Business inventories and GDP set the stage for understanding the hidden dynamics that drive economies forward or hold them back. At their core, they reveal how products flow through industries, how companies plan for the future, and how those decisions ripple through national growth figures. Whether you’re a student, policymaker, or business leader, this topic invites you to explore the fascinating interplay between what’s sitting on warehouse shelves and the bigger picture of economic expansion and contraction.
Business inventories represent the stock of goods that companies hold for future sale or use, including raw materials, work-in-progress items, and finished products. These inventories are critical in sectors like manufacturing, retail, and wholesale, where their management can directly influence production decisions and overall economic activity. By tracking changes in business inventories, economists can gauge shifts in supply and demand, anticipate turning points in the business cycle, and refine GDP calculations to offer a clearer snapshot of economic health.
Business Inventories and Their Role in Economic Performance

Business inventories are an essential aspect of modern economies, acting as both a buffer and a signal within supply chains and the broader market. They represent the stock of finished goods, raw materials, and work-in-process items that companies hold to meet demand, optimize production, and manage uncertainties. Understanding the mechanics and implications of inventory changes is key to grasping broader movements in economic growth and national output.
Definition and Importance of Business Inventories

Inventories encompass all the goods and materials that businesses hold for the purpose of resale or use in production. The main components typically include raw materials, work-in-progress, and finished goods. These components play a critical role in production cycles and sales strategies, adapting to shifts in consumer demand and supply chain dynamics.
While all sectors maintain some level of inventory, the impact of inventory fluctuations is particularly pronounced in industries such as manufacturing, wholesale, and retail. Manufacturing firms, for example, may adjust production in response to rising or falling inventory levels, while retailers rely on inventory to ensure product availability and manage seasonality.
Business inventories represent the value of goods held by firms to smooth production and sales, acting as a key channel through which shifts in demand and supply are transmitted to the broader economy. Their changes can amplify or dampen economic cycles, making them vital for economic analysis.
How Business Inventories Affect GDP Calculations
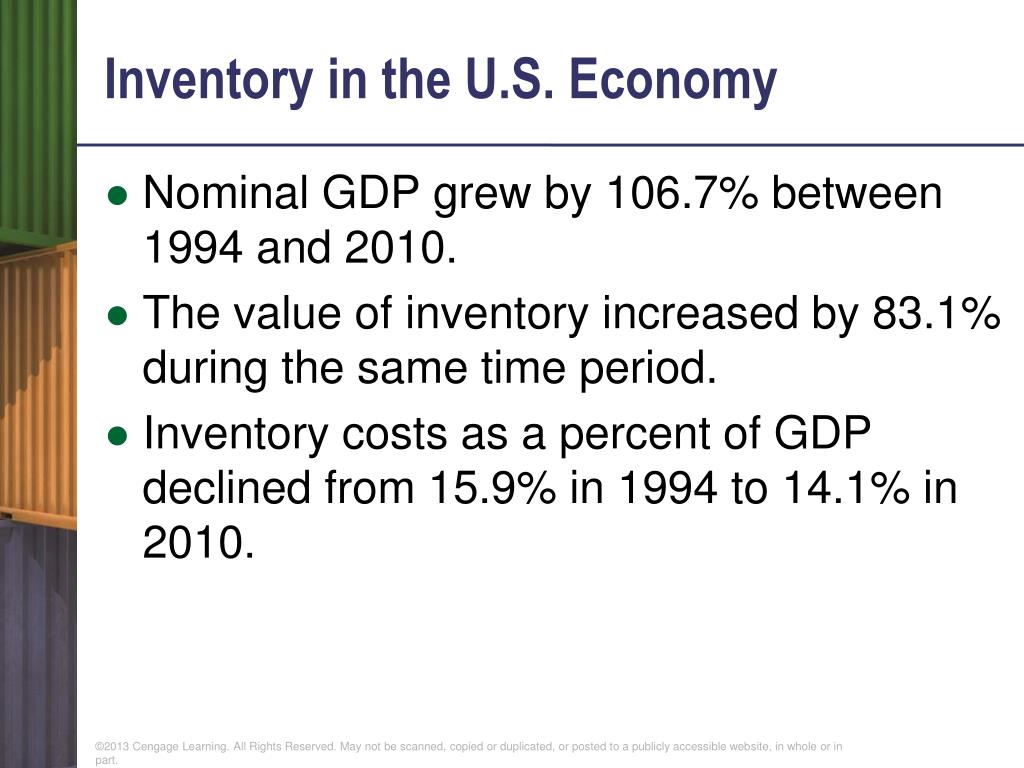
Inventories are a direct component of Gross Domestic Product (GDP) through the expenditure approach. Specifically, changes in private inventories are included as part of Gross Private Domestic Investment. An increase in inventories adds to GDP, as it reflects production not yet sold; conversely, a decrease implies goods are being sold out of existing stocks rather than produced anew, which subtracts from GDP growth.
The magnitude and direction of inventory changes can have a significant impact on quarterly GDP figures. Intended inventory accumulation, where firms consciously build up stocks in anticipation of demand, typically signals business confidence. Unintended accumulation, however, may indicate slower-than-expected sales and potential economic headwinds.
| Year | Inventory Change (Billion USD) | GDP Growth (%) | Contribution to GDP (%) |
|---|---|---|---|
| 2011 | +56.3 | 1.6 | +0.5 |
| 2015 | +80.1 | 2.9 | +0.6 |
| 2020 | -57.3 | -3.4 | -0.8 |
| 2022 | +164.7 | 2.1 | +1.2 |
Intended accumulation typically reflects optimistic sales projections, while unintended accumulation can prompt production cuts and broader economic slowdowns. Understanding this distinction helps analysts interpret the potential implications of inventory data within GDP reports.
The Business Inventory Cycle and Economic Fluctuations
The business inventory cycle describes the systematic pattern of inventory building and depletion that accompanies general economic cycles. This cycle is closely tied to business expectations, consumer demand, and production planning. During expansions, firms often accumulate inventories in anticipation of rising sales, while contractions see inventory drawdowns as demand wanes.
Adjustments in inventories can sometimes precede economic shifts, acting as a leading indicator, while at other times they lag, reflecting adjustments after the fact. This dual nature makes inventory cycles particularly insightful for tracking economic momentum.
- Inventory accumulation often leads expansions when businesses anticipate higher sales and ramp up production.
- Excessive buildup can signal optimism, but if demand falls short, it may result in a sharp cutback in orders and production, amplifying downturns.
- Inventory drawdowns can occur at the onset of recessions as firms clear excess stock, reducing new production orders.
- During recoveries, inventory rebuilding supports economic growth as firms restock to meet improving demand.
The connection between inventory changes and production decisions creates a feedback loop: when inventories rise unexpectedly, production may be scaled back, and vice versa, further influencing the pace of economic expansion or contraction.
Measurement, Interpretation, and Sectoral Perspectives on Business Inventories
Measurement and Reporting of Business Inventories, Business inventories and gdp

National statistical agencies maintain detailed systems for tracking and reporting inventories. In the United States, for instance, the Census Bureau and the Bureau of Economic Analysis (BEA) produce regular reports on inventory levels across key economic sectors. These indicators form a cornerstone of economic monitoring and policy analysis.
| Indicator Name | Frequency | Reporting Agency | Economic Significance |
|---|---|---|---|
| Manufacturing and Trade Inventories | Monthly | U.S. Census Bureau | Tracks inventory trends across goods-producing sectors |
| Business Inventories to Sales Ratio | Monthly | U.S. Census Bureau | Monitors inventory efficiency and sales dynamics |
| GDP Inventory Change Estimate | Quarterly | BEA | Measures the direct contribution of inventories to GDP |
Statistical agencies rely on comprehensive surveys, direct business reporting, and reconciliations across production, trade, and sales data streams to ensure accuracy. Data undergoes regular revision and validation to account for late responses, methodological improvements, and evolving economic conditions.
Business Inventories as Economic Indicators
Inventory data is a trusted tool for economists and policymakers, providing critical insights into the pace and sustainability of economic growth. Shifts in inventories can reveal imbalances between production and demand, serving as early warnings for economic inflection points.
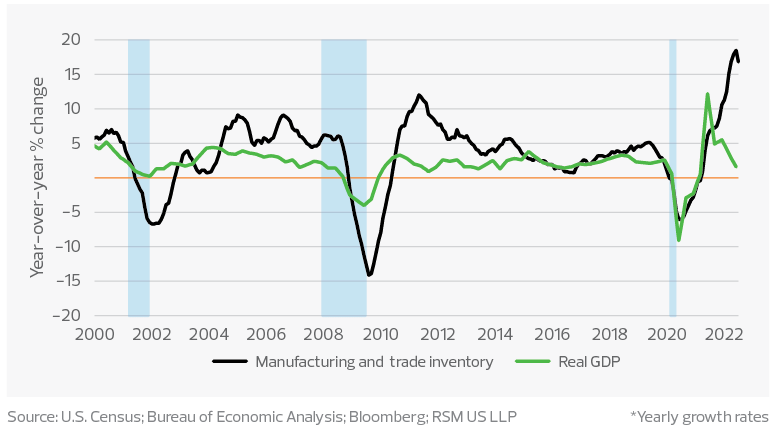
- In Q1 2020, a sharp drop in inventories foreshadowed the broader economic contraction caused by the COVID-19 pandemic.
- During the 2008 financial crisis, a rapid liquidation of inventories signaled and accelerated the downturn.
- Inventory rebuilding in 2009–2010 contributed significantly to the early stages of post-crisis recovery.
- Sudden inventory spikes in the late 1990s were interpreted as signs of overproduction preceding a slowdown.
While inventory data is valuable, it is often considered alongside other leading indicators like new orders, consumer sentiment, and employment figures to provide a fuller picture of the economic outlook.
Sectoral Differences in Inventory Management and GDP Impact
Inventory practices vary significantly across different segments of the economy, shaping both sectoral performance and overall GDP dynamics. Manufacturing sectors typically carry a mix of raw materials and work-in-progress, while retail and wholesale focus on finished goods ready for sale. Inventory turnover rates, types, and management strategies all play roles in determining the sector’s sensitivity to demand shifts and economic cycles.
| Sector | Inventory Turnover Rate | Typical Inventory Types | Impact on GDP |
|---|---|---|---|
| Manufacturing | 6–8 times/year | Raw materials, WIP, finished goods | Directly impacts production and investment figures |
| Retail | 10–12 times/year | Finished goods | Influences consumer spending and inventory investment |
| Wholesale | 8–10 times/year | Bulk finished goods | Bridges supply between manufacturers and retailers, affecting inventory cycles |
Modern inventory management strategies, such as just-in-time (JIT) and lean inventory systems, aim to optimize stock levels, reduce carrying costs, and respond quickly to market changes. These strategies can dampen the volatility of inventory-adjusted GDP figures, but also introduce risks in the event of supply chain disruptions or sudden demand shifts.
Challenges, Limitations, and Illustrative Cases in Inventory Analysis
Challenges and Limitations in Interpreting Inventory Data
While inventory data is a powerful tool, interpreting it requires caution due to various potential distortions and limitations. Factors such as seasonality, one-off events, and external shocks can obscure underlying trends and complicate economic assessment.
Common challenges include:
- Seasonal fluctuations that require adjustment to extract meaningful trends.
- Stockpiling ahead of regulatory changes or anticipated shortages, which may temporarily inflate inventory levels.
- Supply chain disruptions, such as those experienced during natural disasters or geopolitical events, complicate analysis and forecasting.
- Data revisions and updates, often released after the initial report, can substantially alter the perceived trajectory of GDP growth.
Economists and analysts must consider these factors to avoid overinterpreting short-term inventory swings as signals of deeper economic shifts.
Illustrative Scenarios and Case Studies
The importance of business inventories becomes especially clear during periods of rapid economic change. For example, during the early months of the COVID-19 pandemic, global supply chain disruptions caused sharp declines in inventory restocking, which in turn contributed to contractions in GDP across many advanced economies.
“Inventories played a pivotal role in the sharp downturn of early 2020. Supply chain paralysis meant that firms could not replenish stocks, amplifying the economic shock and delaying recovery even after demand began to return.” — Economic analyst, April 2021
“Historically, inventory cycles have acted as both a cushion and a catalyst. During the 2008-2009 crisis, rapid inventory liquidation deepened the recession, but subsequent rebuilding supported an unexpectedly fast rebound.” — Chief Economist, 2015
A hypothetical scenario further clarifies the mechanics:
- Companies overestimate demand and ramp up production, resulting in surplus inventory.
- As sales fall short, inventories accumulate beyond desired levels.
- Firms cut production orders, leading to layoffs and reduced business investment.
- The reduction in production and employment feeds back into lower consumer spending, amplifying the downturn.
- Over time, excess inventories are worked down, and production stabilizes as demand recovers.
Concluding Remarks
The discussion on business inventories and GDP reveals just how tightly woven inventory management is with the ups and downs of the broader economy. By decoding inventory patterns, we gain a sharper lens for forecasting growth, identifying brewing slowdowns, and making smarter decisions—whether in boardrooms or on policy desks. Ultimately, keeping a close watch on inventories offers a powerful tool for anyone seeking to stay ahead of economic trends and uncertainties.
Expert Answers: Business Inventories And Gdp
How do business inventories directly impact GDP figures?
Business inventories are part of the investment component in GDP calculations. When inventories rise, it signals that production exceeded sales, adding to GDP. Conversely, a decline suggests sales outpaced production, subtracting from GDP.
Why do economists closely watch changes in inventories?
Changes in inventories can indicate future production adjustments. If inventories rise unexpectedly, companies may slow production, while falling inventories can signal the need to ramp up output, both of which affect economic growth.
What are the main challenges in measuring business inventories accurately?
Challenges include seasonality, reporting delays, stockpiling due to supply chain disruptions, and revisions to initial data, all of which can distort the true economic picture.
Are inventory changes always a sign of economic weakness or strength?
Not always. Sometimes inventory buildups are intentional, ahead of expected demand, while at other times they reflect miscalculated forecasts. The context is key to interpreting what inventory changes really mean for the economy.
How do different industries’ inventory practices affect GDP?
Sectors like manufacturing often experience large inventory swings that can significantly influence GDP, while service-based sectors typically have less inventory impact. Each industry’s management strategies play a unique role in shaping overall economic trends.
